|
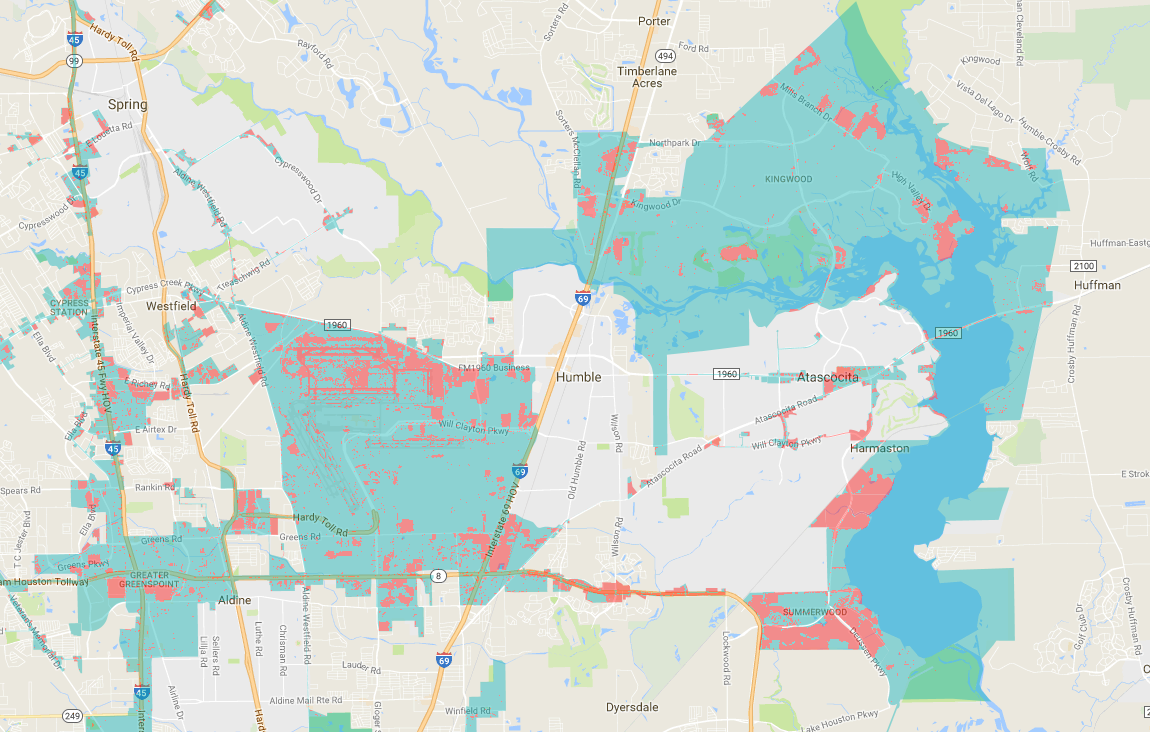
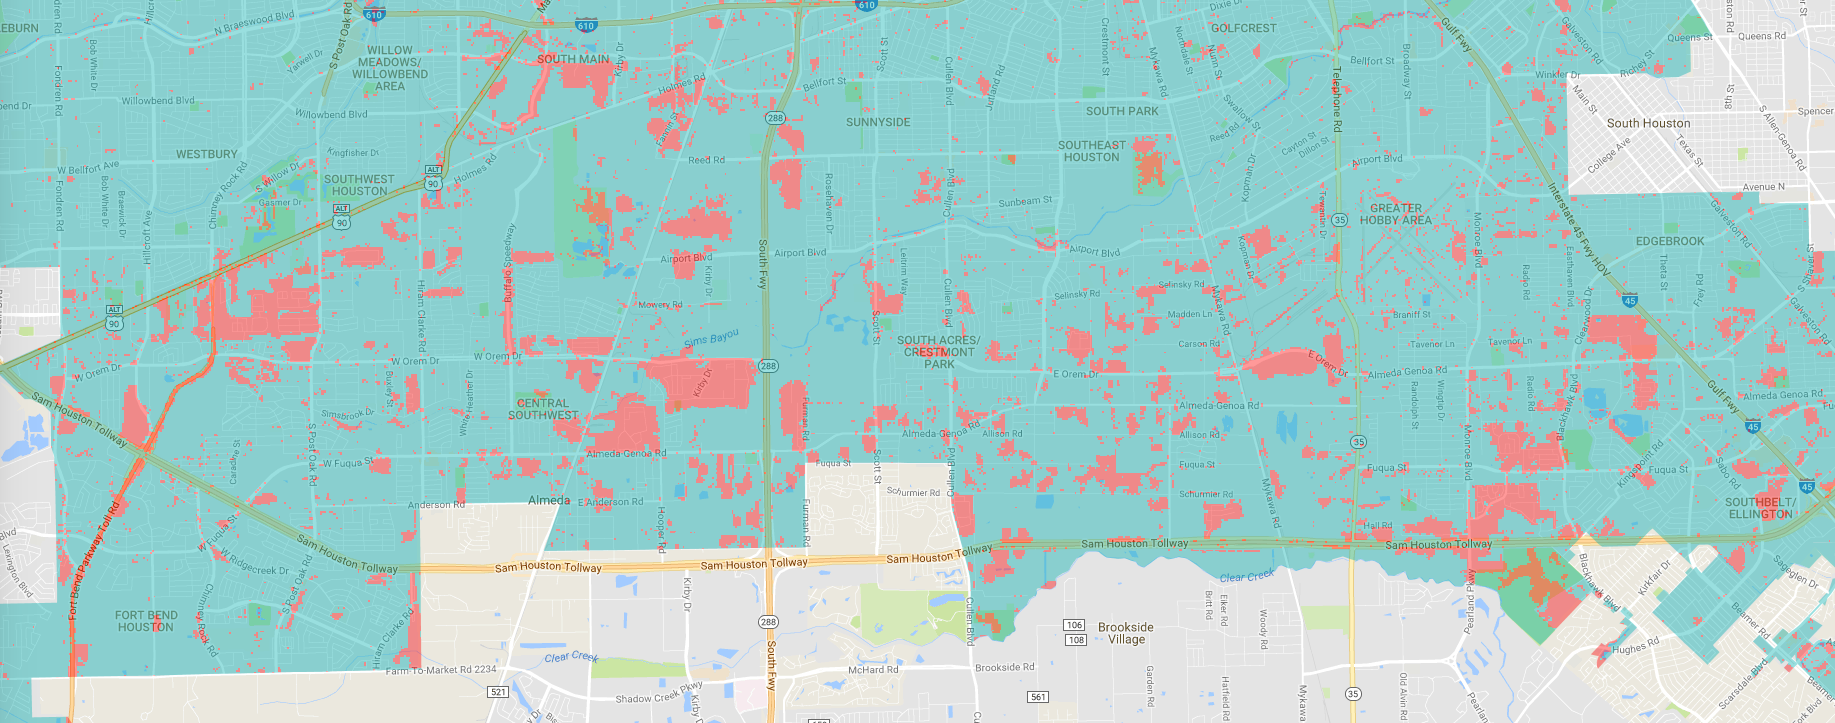
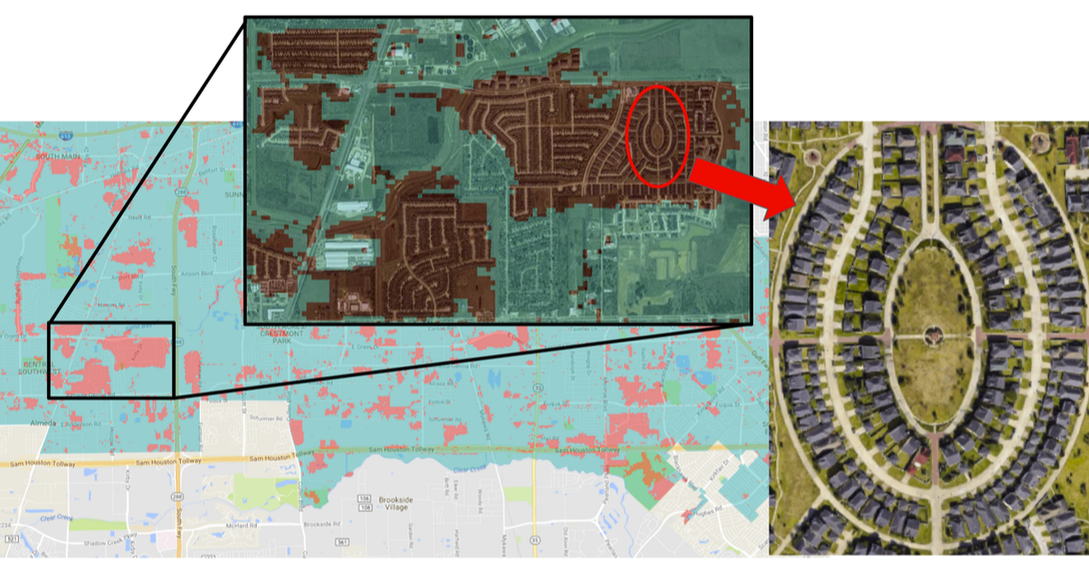
I was fortunate enough to dodge major flooding events when I lived in Houston, but in the still-unfolding tragedy, calling Harvey Houston's Katrina seems more fitting. I heard today a report on Marketplace with Kai Ryssdal an interview with Neena Satija, a reporter for the Texas Tribune. She specifically mentioned the explosion in development that Houston has experienced recently and it got me wondering what the actual number is. How many square miles of new impervious surface have gone up recently? The best I could do is to calculate the increase from 2001 to 2011 using the National Land Cover Databse. In that single decade, 112.88 square km or 43.58 square miles of impervious surfaces were created. This number is staggering. It represents 6.87% of Houston's current land area of 1642 square km. A description of my methods are below. 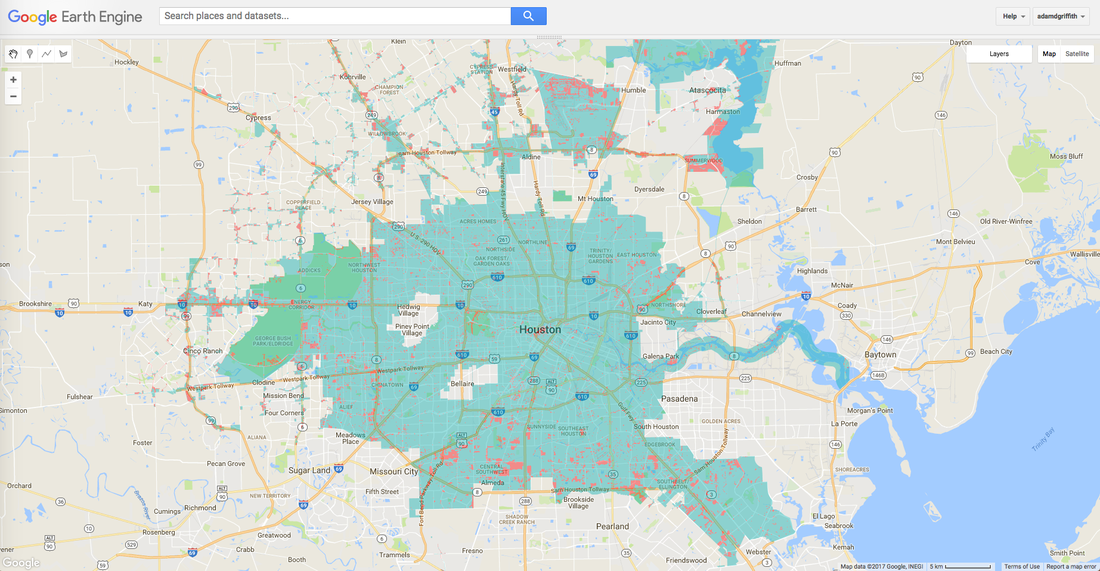 Overview: The image above shows the Houston city limits in blue-green and development built between 2001 and 2011 in orange. The development shown here is greater than 50% impervious surfaces. North Houston: The above image highlights large new housing development along the shores of Lake Houston on the right. The new runway and construction at Bush Intercontinental Airport is visible just left of center. South Houston: A patchwork of new development between the Sam Houston Tollway (8) and I-610. The larger patches are large housing developments built between 2001 and 2011. Methods:
To answer this question, I used the National Land Cover Database, a 30 meter resolution dataset produced every 5 years. I used Google Earth Engine's code editor to crunch the land cover numbers. For the Houston city limits, I downloaded the shapefile from the City of Houston OpenData portal and converted it to a public Google FusionTable using shpescape.com. I calculated area of pixels with a permeability threshhold of less than 50% for 2001 and 2011 and subtracted. Permeability of less than 50% is the same as greater than 50% impermeable. Link to code for those with access to Google Earth Engine Link to code on GitHub Limitations: These calculations do not include independent cities within the Houston City limits such as Bellaire. Sadly, the 2016 data are unavailable and calculations from 2001 to 2011 are the best numbers immediately available. I will re-run the analysis when the 2016 data are available. Some areas that are not developed appear to be developed due to the spectral signature reflected to the sensor. Conversely, some areas that are shown as impermeable may not be. This peer reviewed study shows the NLCD classification accuracy around 79%. This study from Roanoke, VA shows the NLCD impervious surface accuracy to be around 70%. |
ideasinteresting tidbits from my geography classes and academic life Archives
June 2018
|
 RSS Feed
