|
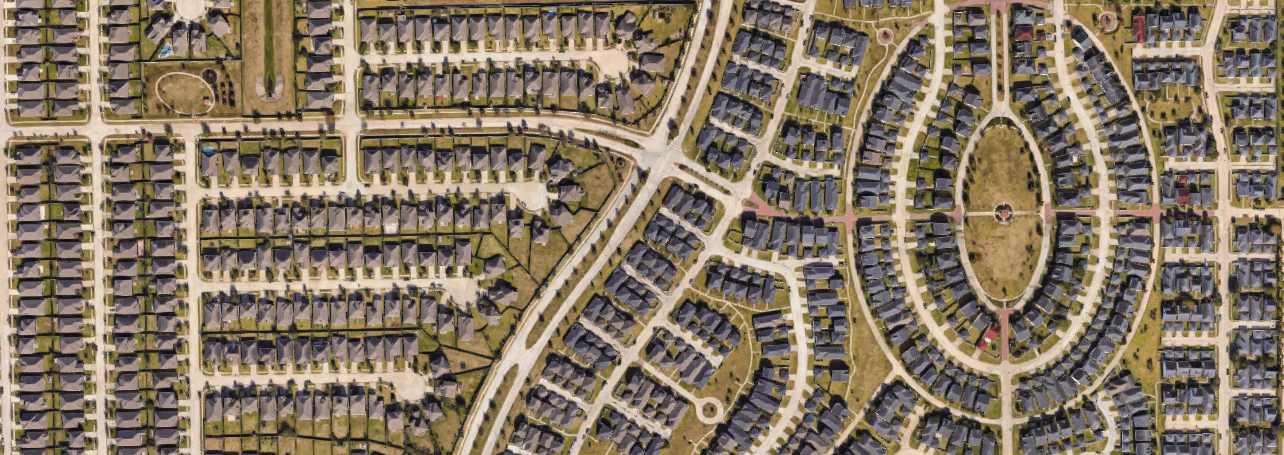
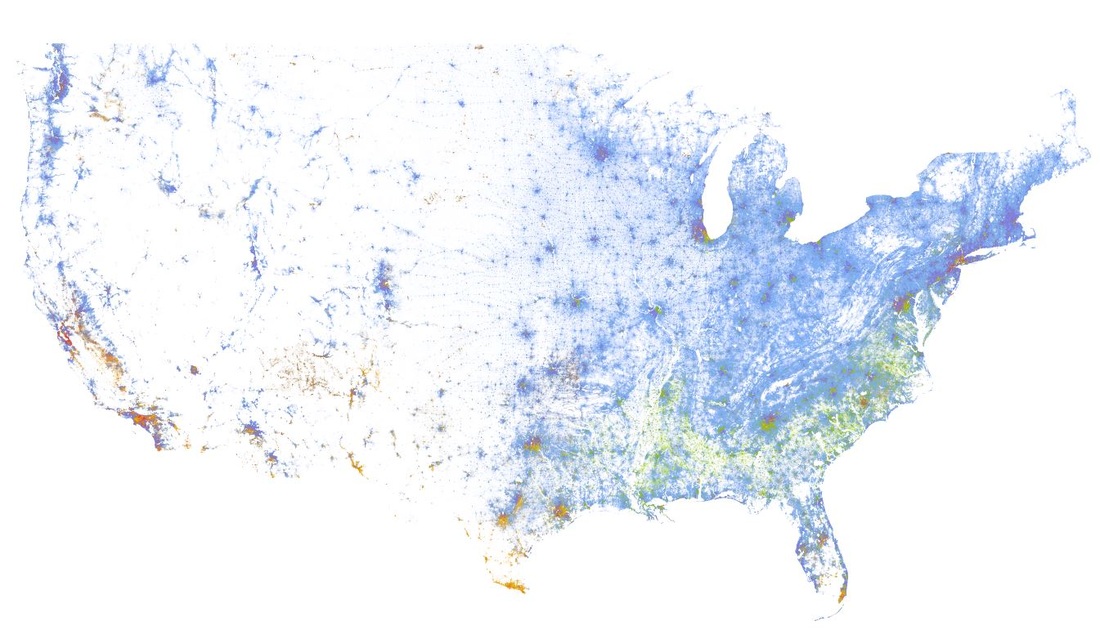
This dot map was developed by Dustin Cable at UVA with some inspiration from some folks at MIT who helped created social media dot maps. Look at the distribution of different races in your area. We are still reeling from the effects of the segregation, racial profiling, redlining, the Eisenhower Interstate System, and much more. Check it out here: http://demographics.coopercenter.org/DotMap/
|
ideasinteresting tidbits from my geography classes and academic life Archives
June 2018
|


 RSS Feed
